ProductPart of How: how it keeps going
Value & Adoption Cockpit
One view of literacy, adoption and agreed outcome measures.
Live demoTry the three tabs and the filters. In production at our life sciences reference.
Why it is needed
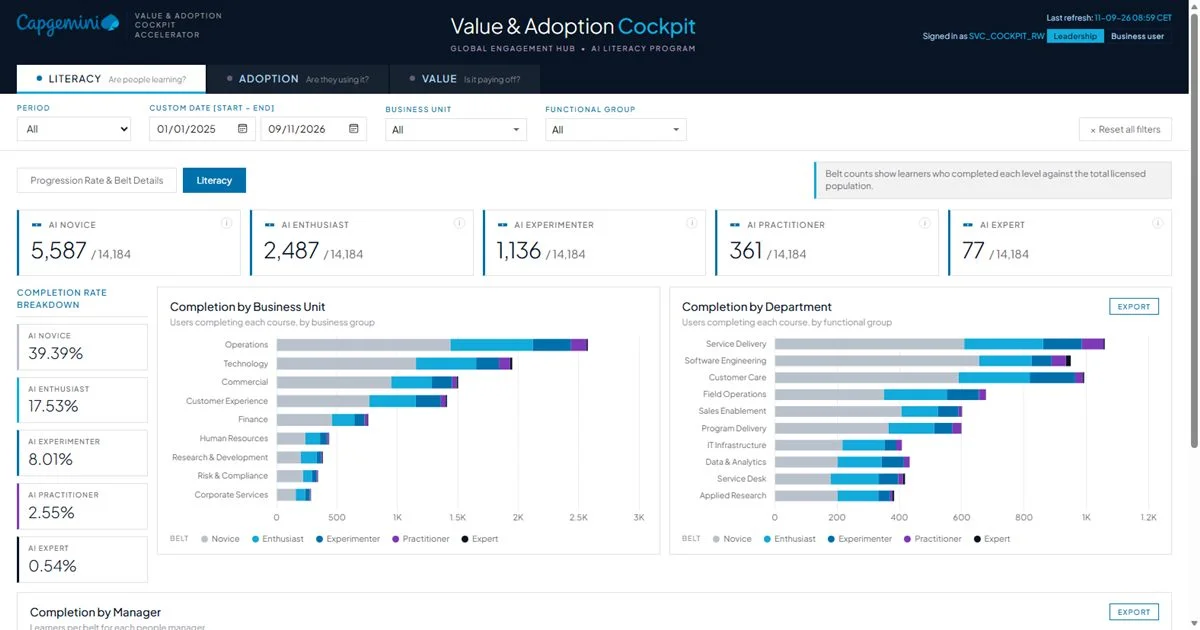
Leaders are spending on AI and cannot see what comes back, especially outside technical teams. The cockpit shows, in one place, whether people are building skills, using the tools and changing how they work. It keeps each layer of evidence separate, so an early signal is never read as a proven result. It has 18 metrics across literacy, adoption and value.
Where it fits
Measurement is designed in Foundation. The cockpit itself is usually part of Scaling, the second phase.What it does
For the learner
- Learners appear only in aggregate views
- Their data is never used to rank or assess individual performance
For the manager
- Completion and belt progress for the team
- Active and returning users, by department and persona
- Where the team needs a champion or more support
For the leader
- Three tabs: Literacy (are people learning?), Adoption (are they using it?) and Value (is it paying off?)
- Literacy, adoption and estimated productivity side by side
- Drill down by time span, business unit, functional group and persona
- See which licenses are unused
- Trends over time, with data freshness shown
- Export for the data-heavy charts
What it is not
- It displays agreed measures. It does not prove that AI caused a change.
- Financial value needs a client-specific baseline, attribution and validation by a business owner.
- It is not a tool for evaluating or ranking employees.
Platform and data dependencies
- Built in Power BI
- Learning completion data from your LMS
- Approved usage telemetry from your AI platform
- A metric dictionary agreed with you, with named data owners and refresh rules
- An operational handbook for your support team: architecture, data flows, refresh schedules and monitoring